

Role of climate and weather in crop production and management
Climate and weather are significant factors affecting agriculture production around the world. Both seasonal and regional variability in weather directly influences crop yield potential. While advances in technology have enabled farmers to adopt modern techniques in agriculture and thus enhance their farm output, weather remains a major factor affecting their crops. From plantation to harvest, precipitation, temperature, sunshine hours and wind can affect the quality and quantity of a crop. The correlation between crop volumes and weather can result in a successful yield or a financial disaster. Extended droughts, heat waves, and ill-timed freezes cause widespread crop losses with massive impacts on regional food production, underlining the importance of weather forecasting in agriculture. Farmers around the world are grappling with fluctuating weather patterns among other factors. As a result, farmers need to be increasingly efficient in their management practices keeping a tab on weather and climate fluctuations.
Weather forecasting methodology
Modern-day weather forecasting is entirely based on numerical weather prediction techniques. The basic idea of numerical weather prediction (NWP) is to sample the state of the fluid at a given time and use the equations of fluid dynamics and thermodynamics to estimate the state of the fluid at some time in the future. The observational inputs for operating these NWP systems are provided by several conventional and nonconventional sources. Country-based weather services provide the surface observations from manually operated and automated weather stations at ground level over land and from weather buoys at sea. The World Meteorological Organization acts to standardize the instrumentation, observing practices and timing of these observations worldwide. Stations either report hourly in METAR reports, or every six hours in SYNOP reports. Sites launch radiosondes, which rise through the depth of the troposphere and well into the stratosphere, which provide the upper air observations TEMP/PILOT containing essential meteorological parameters like temperature, wind, humidity. Data from weather satellites are used in areas where traditional data sources are not available. Compared with similar data from radiosondes, the satellite data has the advantage of global coverage, however at a lower accuracy and resolution. Meteorological radar provides information on precipitation location and intensity, which can be used to estimate precipitation accumulations over time. Additionally, if a pulse Doppler weather radar is used then wind speed and direction can be determined. Commercial flights provide aircraft reports along flying routes, and commercial ships provide ship reports along shipping routes. Research flights using reconnaissance aircraft fly in and around weather systems of interest such as tropical cyclones. Reconnaissance aircraft are also flown over the open oceans during the cold season into systems that cause significant uncertainty in forecast guidance or are expected to be of high impact 3–7 days into the future over the downstream continent.
NWP Models are initialized using this observed data. The irregularly spaced observations are processed by data assimilation and objective analysis methods, which perform quality control and obtain values at locations usable by the model’s mathematical algorithms (usually an evenly spaced grid). The data are then used in the model as the starting point for a forecast. Commonly, the set of equations used to predict the known physics and dynamics of the atmosphere are called primitive equations. These equations are initialized from the analysis data and rates of change are determined. The rates of change predict the state of the atmosphere a short time into the future. The equations are then applied to this new atmospheric state to find new rates of change, and these new rates of change predict the atmosphere at a yet further time into the future. This time stepping procedure is continually repeated until the solution reaches the desired forecast time. The length of the time step is related to the distance between the points on the computational grid.
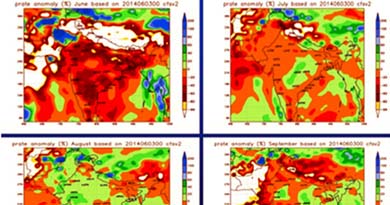
There are several advanced NWP centers in the world which run their own weather and climate forecast systems. For example one of the prominent centers is US NOAA’s National Center for Environmental Prediction (NCEP) which operates a Global Forecast System (GFS) for short and medium-range weather forecasts and a Climate Forecast System (CFS) for extended range, monthly and seasonal forecasts. As with most works of the U.S. government, GFS/CFS data are not copyrighted and are available for free in the public domain under provisions of U.S. law. Gridded data are available for download through the NOAA National Operational Model Archive and Distribution System (NOMADS). Forecast products and more information on GFS are available at the GFS home page. Because of this, the model serves as the basis for the forecasts of numerous private, commercial and foreign weather companies. Dozens of atmospheric and land-soil variables are available through this dataset, from temperatures, winds, and precipitation to soil moisture and atmospheric ozone concentration.
At WRMS the gridded datasets of GFS and CFS, which are in GRIB2 code form are downloaded. The raw data are subjected to decoding and post-processing procedures through software package developed at WRMS to extract values of several atmospheric parameters of interest, such as temperatures, wind, humidity, precipitation, short and longwave radiation, sunshine hours etc. The post-processed datasets are available at grid points separated by 25 km in GFS and about 100 km in CFS. The grid data are also interpolated to specific station locations using an algorithm. Graphics maps are prepared for synoptic analysis. The data formats are customized for supply to various user groups.